 Go Back
 Shell Scripting With ChatGPT
Date: 7/1/2023
Table of Contents
Start with a list
Recently I am on a mission to better understand my operating system. In my case that is Windows, which is also widely used at work. So, while I am curious to get deeper into MacOS, for now I will be focusing on PowerShell scripts and where better to learn the basics than with a ChatGPT session?
Entering that as a message to ChatGPT yielded a veritable flood of ideas that some might refer to as an under-baked listicle. Lots of potential. What to learn first?
Well, let's start with the ideas.
Wow, that's a lot of ideas for such a short prompt!
Generate a system monitoring report
You can blame recency bias - the last one stood out to me so that's the first one we will explore.
The first pass only includes CPU usage, which is nice to know, but a bit incomprehensive. I noticed in the initial response that memory and disk usage were also mentioned, so I asked for those to be added.
$reportPath = "C:\Reports\System_Monitoring_Report.html"
$cpuThreshold = 80 # Set the threshold percentage for high CPU usage
$memoryThreshold = 90 # Set the threshold percentage for high memory consumption
$diskThreshold = 80 # Set the threshold percentage for high disk usage

# Get current CPU usage percentage
$cpuUsage = (Get-WmiObject -Class Win32_Processor
| Measure-Object -Property LoadPercentage -Average).Average

# Get current memory consumption percentage
$memoryUsage = Get-Counter -Counter "\Memory\% Committed Bytes In Use"
| Select-Object -ExpandProperty CounterSamples
| Select-Object -ExpandProperty CookedValue

# Get disk space usage percentage for the C drive
$diskUsage = (Get-WmiObject -Class Win32_LogicalDisk -Filter "DeviceID='C:'"
| Select-Object -ExpandProperty FreeSpace)
/ (Get-WmiObject -Class Win32_LogicalDisk -Filter "DeviceID='C:'"
| Select-Object -ExpandProperty Size) * 100
$diskUsage = [Math]::Round($diskUsage, 2)

# Check if CPU, memory, or disk usage exceeds the thresholds
$highCpuUsage = $cpuUsage -gt $cpuThreshold
$highMemoryUsage = $memoryUsage -gt $memoryThreshold
$highDiskUsage = $diskUsage -gt $diskThreshold

# Generate the HTML report
$htmlReport = @"
<!DOCTYPE html>
<html>
<head>
    <title>System Monitoring Report</title>
    <style>
        body {
            font-family: Arial, sans-serif;
        }
        .header {
            background-color: #333;
            color: #fff;
            padding: 10px;
        }
        .content {
            padding: 20px;
        }
        .high-usage {
            color: red;
            font-weight: bold;
        }
    </style>
</head>
<body>
    <div class="header">
        <h1>System Monitoring Report</h1>
    </div>
    <div class="content">
        <h2>CPU Usage: <span class="$([bool]$highCpuUsage -as [int])">
        $(if ($highCpuUsage) { "<span class='high-usage'>$cpuUsage%</span>" }
        else { "$cpuUsage%" })</span></h2>
        <h2>Memory Consumption: <span class="$([bool]$highMemoryUsage -as [int])">
        $(if ($highMemoryUsage) { "<span class='high-usage'>$memoryUsage%</span>" }
        else { "$memoryUsage%" })</span></h2>
        <h2>Disk Space Usage (C:): <span class="$([bool]$highDiskUsage -as [int])">
        $(if ($highDiskUsage) { "<span class='high-usage'>$diskUsage%</span>" }
        else { "$diskUsage%" })</span></h2>
    </div>
</body>
</html>
"@

# Save the report to a file
$htmlReport | Out-File -FilePath $reportPath

# Open the report in the default web browser
Start-Process $reportPath
Dive into memory usage
This short script is teaching me a lot. I follow how the variables are being assigned values in the first half of the script, and see them used in the HTML report which is then saved and opened in the default browser.
I have not worked with many of the properties before, so I asked about the $memoryUsage line of code.
Save the date
The base version of the report is great. One issue is that each time the script is run, the file will be overwritten. To fix this, I adjust the script to construct a file path that includes the current time. This will generate unique files as long as they are created at least one second apart. That's close enough for me!
$reportFolder = "C:\Reports"
$currentTime = Get-Date -Format "yyyyMMdd_HHmmss"
$reportPath = Join-Path -Path $reportFolder -ChildPath "System_Monitoring_Report_$currentTime.html"
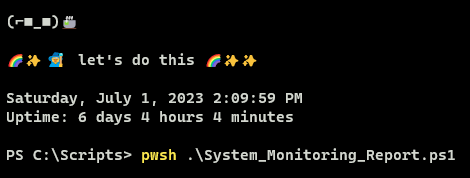
Running the script:

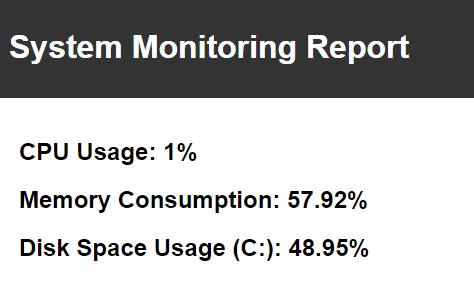
Result in default browser:

Here is how the simple report should look in your default browser. Sure, it's barebones, but sometimes that is exactly what is called for.
With the updates to the script to include the current date and time in the file path, this script serves as an efficient way to collect snapshots of system usage over time. More information could be added to the report, or you could always go look at Task Manager.
This script is more of a learning tool to identify what to learn next.
Convert to bash
Seeing ChatGPT whip this script out in seconds flat has been entertaining to say the least. Since I have a MacBook Air for personal use, I wanted to play some more with this simple script.
Let's see how converting to Bash goes:
#!/bin/bash

report_folder="/Users/your_username/Reports"
current_time=$(date +"%Y%m%d_%H%M%S")
report_path="$report_folder/System_Monitoring_Report_$current_time.html"

cpu_threshold=80 # Set the threshold percentage for high CPU usage
memory_threshold=90 # Set the threshold percentage for high memory consumption
disk_threshold=80 # Set the threshold percentage for high disk usage

# Get current CPU usage percentage
cpu_usage=$(ps -A -o %cpu | awk '{s+=$1} END {print s}')

# Get current memory consumption percentage
memory_usage=$(ps -A -o %mem | awk '{s+=$1} END {print s}')

# Get disk space usage percentage for the root directory
disk_usage=$(df -h / | tail -1 | awk '{print $5}' | tr -d '%')

# Check if CPU, memory, or disk usage exceeds the thresholds
high_cpu_usage=$(awk -v cpu_usage=$cpu_usage -v cpu_threshold=$cpu_threshold 'BEGIN {print (cpu_usage > cpu_threshold)}')
high_memory_usage=$(awk -v memory_usage=$memory_usage -v memory_threshold=$memory_threshold 'BEGIN {print (memory_usage > memory_threshold)}')
high_disk_usage=$(awk -v disk_usage=$disk_usage -v disk_threshold=$disk_threshold 'BEGIN {print (disk_usage > disk_threshold)}')

# Generate the HTML report
html_report=$(cat <<EOF
<!DOCTYPE html>
<html>
<head>
    <title>System Monitoring Report</title>
    <style>
        body {
            font-family: Arial, sans-serif;
        }
        .header {
            background-color: #333;
            color: #fff;
            padding: 10px;
        }
        .content {
            padding: 20px;
        }
        .high-usage {
            color: red;
            font-weight: bold;
        }
    </style>
</head>
<body>
    <div class="header">
        <h1>System Monitoring Report</h1>
    </div>
    <div class="content">
        <h2>CPU Usage: <span class="$high_cpu_usage">$(if [ "$high_cpu_usage" -eq 1 ]; then echo "<span class='high-usage'>$cpu_usage%</span>"; else echo "$cpu_usage%"; fi)</span></h2>
        <h2>Memory Consumption: <span class="$high_memory_usage">$(if [ "$high_memory_usage" -eq 1 ]; then echo "<span class='high-usage'>$memory_usage%</span>"; else echo "$memory_usage%"; fi)</span></h2>
        <h2>Disk Space Usage (root): <span class="$high_disk_usage">$(if [ "$high_disk_usage" -eq 1 ]; then echo "<span class='high-usage'>$disk_usage%</span>"; else echo "$disk_usage%"; fi)</span></h2>
    </div>
</body>
</html>
EOF
)

# Save the report to a file
echo "$html_report" > "$report_path"

# Open the report in the default web browser
open "$report_path"
There was some explanation provided about the nature of the changes.
The first pass was running fine once I entered my username. What did not look correct was seeing CPU usage over 200%. I asked if that value could be revised, but then it showed 0%. Then I looked up a command to see CPU usage on Mac and asked ChatGPT to use that.
Similarly, for disk usage, that command was working fine, but it was pointing to the root instead of /System/Volumes/Data.
Making both of these adjustments leaves me with values that make more sense. Memory usage looks high, however when checked against Activity Monitor the numbers seem accurate. I will have to learn about 'Memory Pressure' since that still looks low. I'd rather my system be using as much memory as possible to let the CPU breathe, and that seems to be happening.
Here are the updated assignments:
# --snip--

# CHANGED
# Get current CPU usage percentage
cpu_usage=$(top -l 2 -n 0 | grep -E "^CPU" | tail -1 | awk '{print $3}')

# --memory_usage is unchanged for now--

# CHANGED
# Get disk space usage percentage for the root directory
disk_usage=$(df -h /System/Volumes/Data | tail -1 | awk '{print $5}' | tr -d '%')

# --snip--
Shell scripting summation
Generating these scripts with the help of ChatGPT was a lot of fun. I'd like to think I learned a few things along the way. I still have tons to learn about operating systems and scripting languages.
Before running these scripts I made sure to understand the gist of what was happening, stopping to look up new properties and methods I had not yet encountered. I enjoy this approach to learning at times more than attempting to read documentation from start to finish.